How was the real estate market in June 2024? After half a year, we return to the East Bay areas of Fremont, the Tri-Valley region of Pleasanton, the South Bay cities of Cupertino and Campbell, and the Peninsula area of Belmont. We will provide you with detailed transaction data analysis from different ZIP code areas.
First, let's start with Fremont in the East Bay, which includes four postal code areas: 94539, 94538, 94536, and 94555. We will analyze them one by one for you:
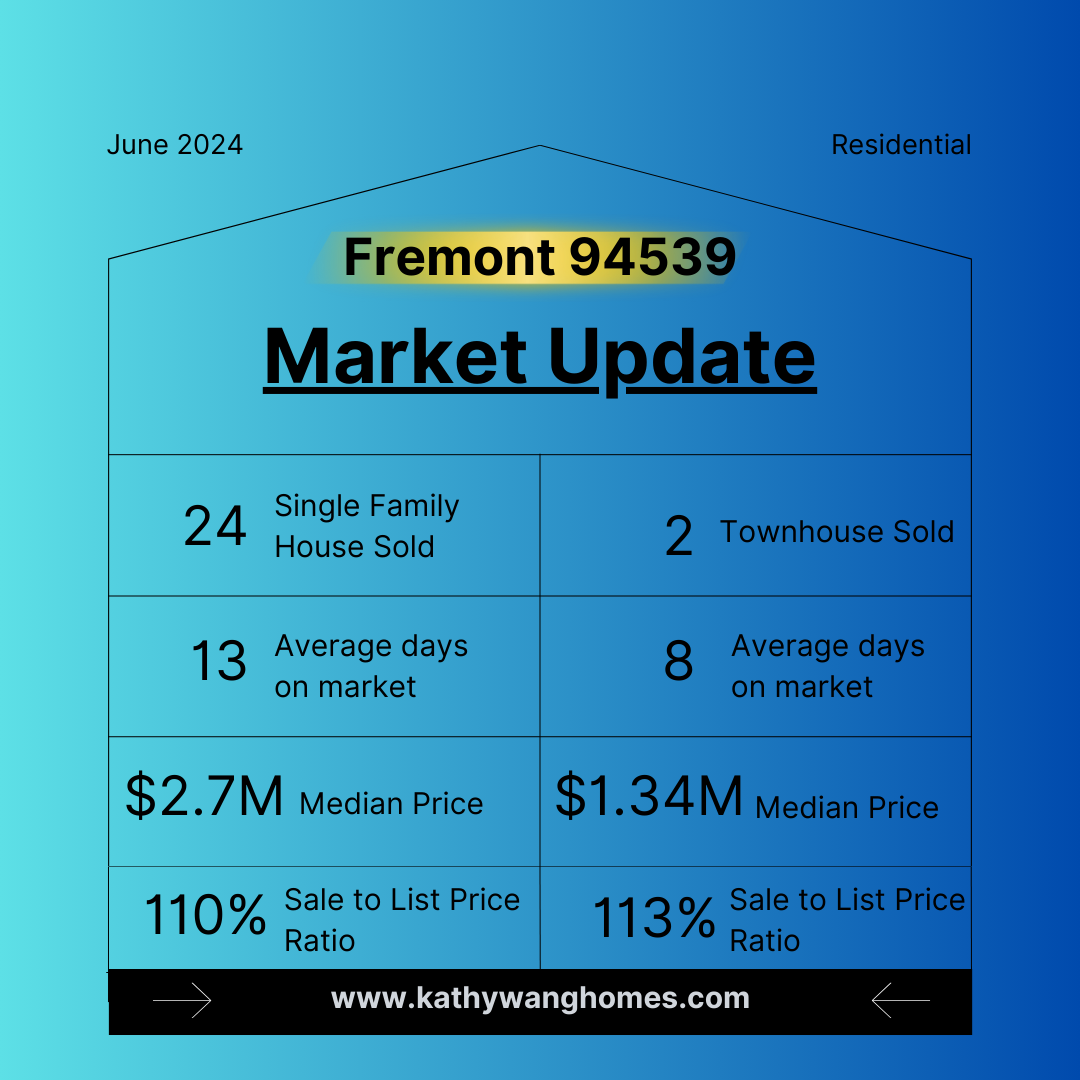
In the 94539 area of Fremont, in June 2024, a total of 24 single-family homes were sold. The median sale price was $2.7 million, with an average sale price to list price of 110%. Single-family homes in this area stayed on the market for an average of 13 days. Additionally, there were 2 townhouse sold in this area, with a median home price of $1.34 million, and an average sale price to list price of 113%. Townhouses in this area stayed on the market for an average of 8 days.
In the 94538 area of Fremont, in June 2024, a total of 20 single-family homes were sold. The median sale price was $1.67million with an average sale price to list price of 108%. Single-family homes in this area stayed on the market for an average of 11 days. Additionally, there were 3 townhouse sold in this area, with a median home price of $1.02million, and an average sale price to list price of 103%. Townhouses in this area stayed on the market for an average of 12 days.
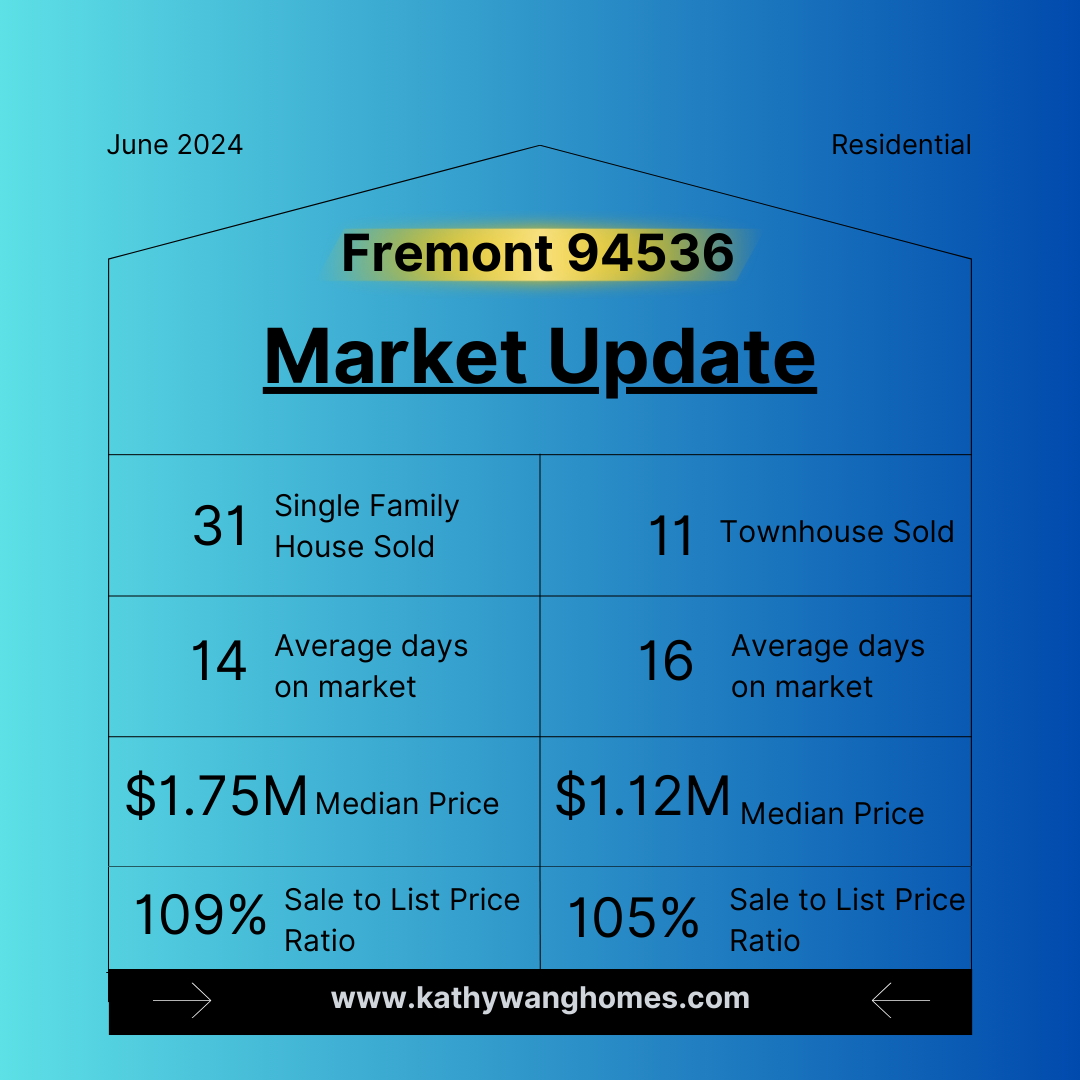
In the 94536 area of Fremont, in June 2024, a total of 31 single-family homes were sold. The median sale price was $1.75 million, with an average sale price to list price ratio of 109%. Single-family homes in this area stayed on the market for an average of 14 days. Additionally, there were 11 townhouse sold in this area, with a median home price of $1.12 million, and an average sale price to list price ratio of 105%. Townhouses in this area stayed on the market for an average of 16 days.
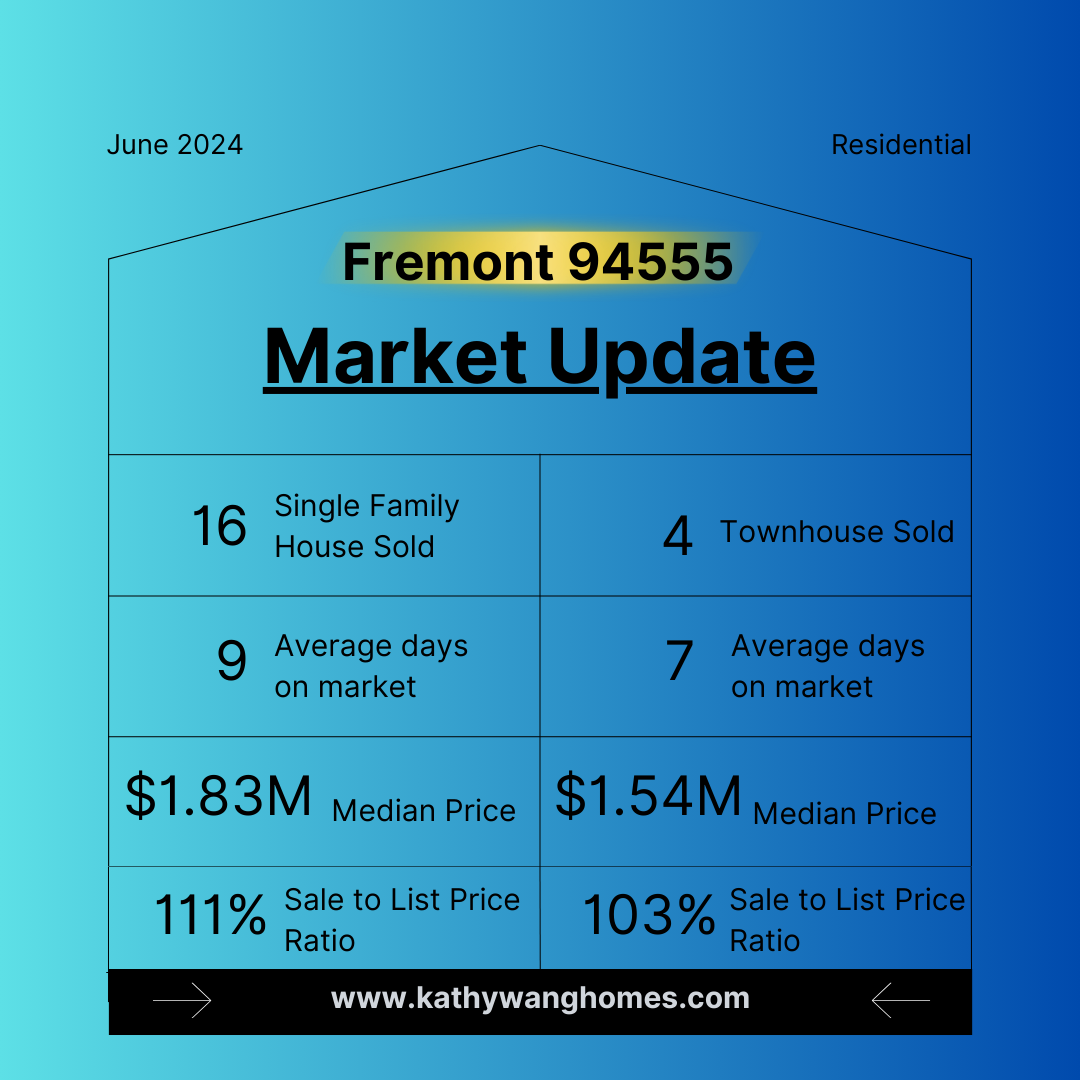
In the 94555 area of Fremont, in June 2024, a total of 4 single-family homes were sold . The median home price was $1.54 million, with an average sale price to list price of 103%. Single-family homes in this area stayed on the market for an average of 9 days. Additionally, there were 4 townhouse transactions in this area, with a median home price of $1.54 million, and an average sale price to list price ratio of 103%. Townhouses in this area stayed on the market for an average of 7 days.

Next, let's take a look at the city of Pleasanton in the Tri-Valley region, which includes two postal code areas: 94566 and 94588. We will analyze them one by one for you:
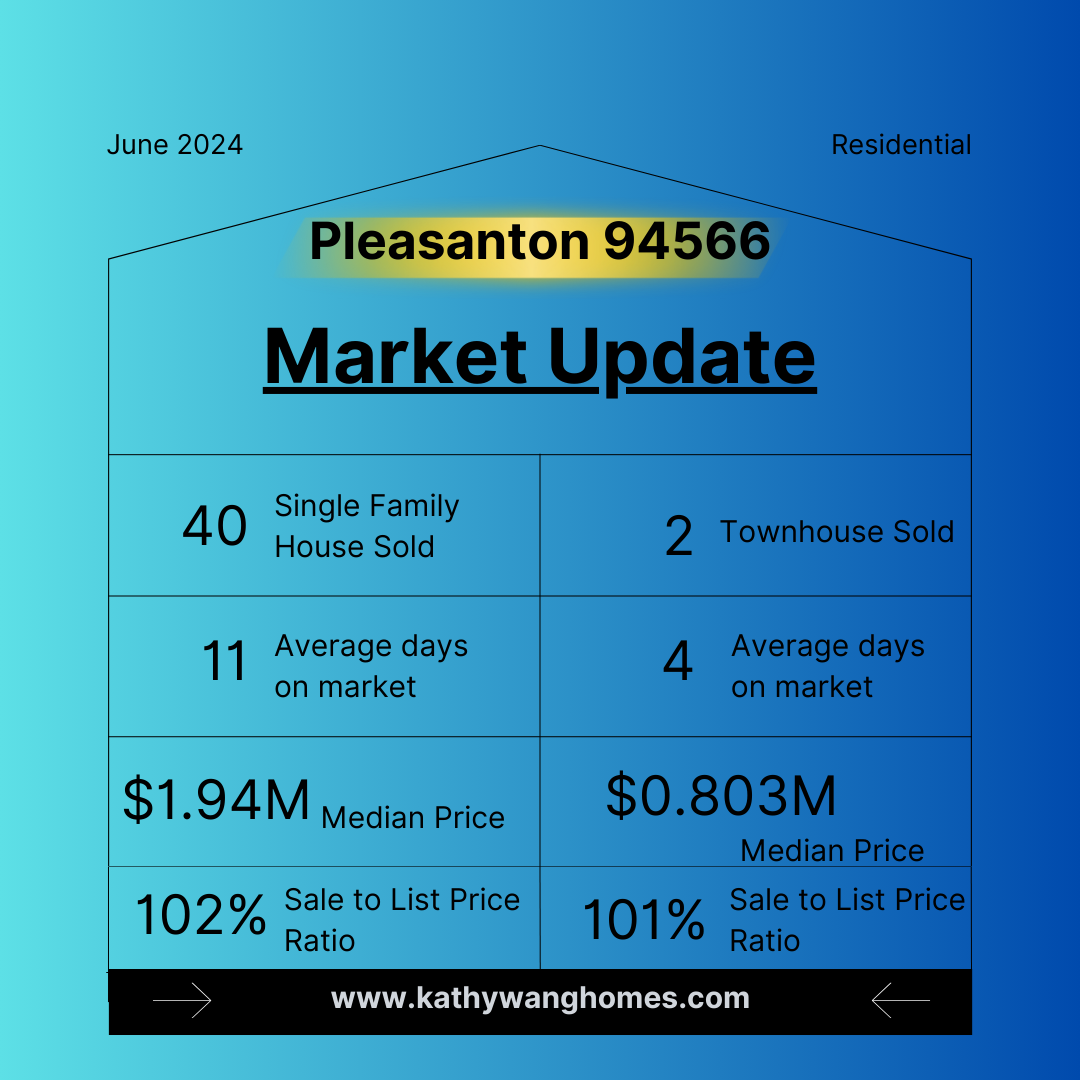
In the 94566 area of Pleasanton, in June 2024, there were a total of 40 single-family home transactions. The median home price was $1.94 million, with an average sale price to list price ratio of 102%. Single-family homes in this area stayed on the market for an average of 11 days. Additionally, there were 2 townhouse transactions in this area, with a median home price of $803,000, and an average sale price to list price ratio of 101%. Townhouses in this area stayed on the market for an average of 4 days.
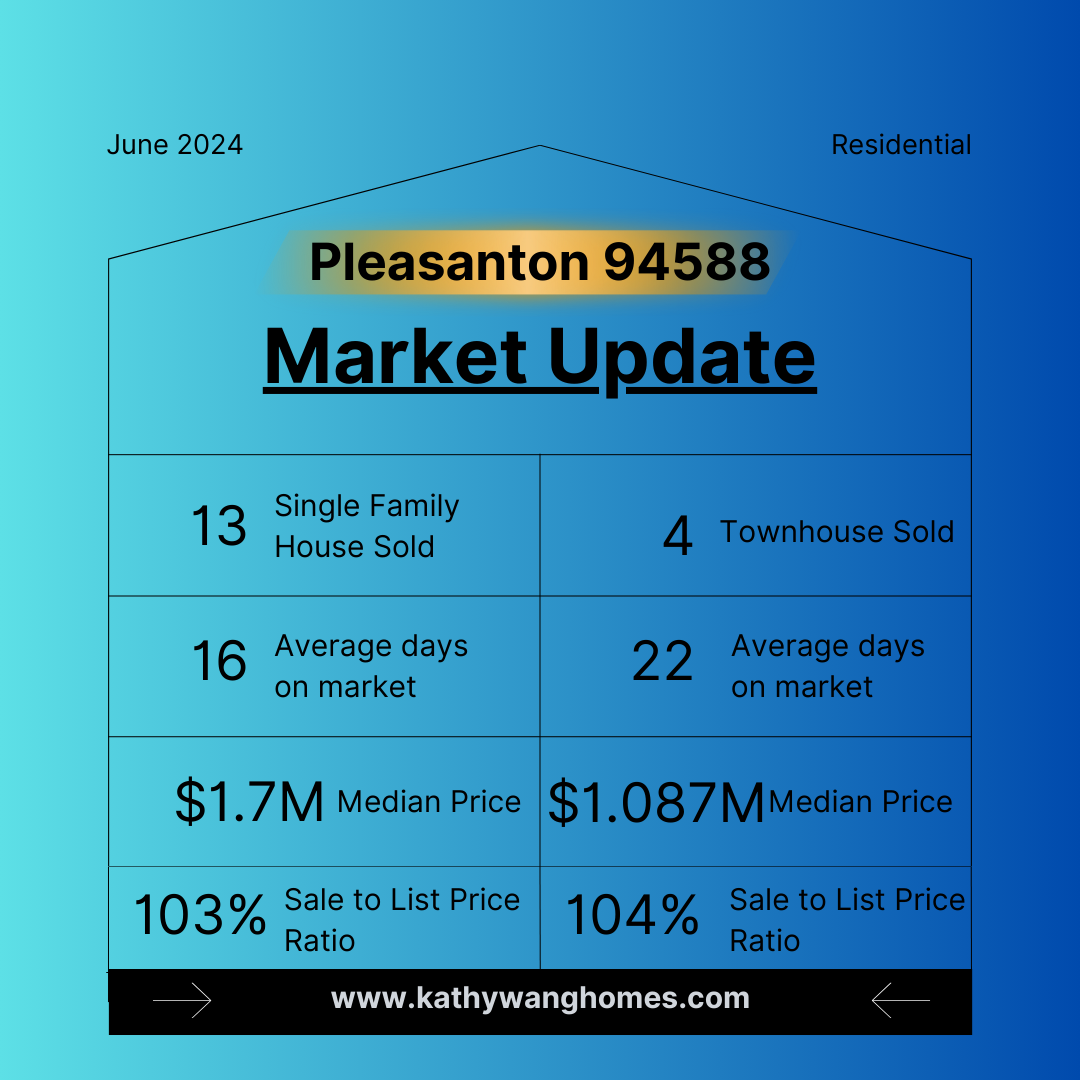
In the 94588 area of Pleasanton, in December 2023, there were a total of 4 single-family home transactions. The median home price was $1.56 million, with an average sale price to list price ratio of 99%. Single-family homes in this area stayed on the market for an average of 23 days. Additionally, there was 1 townhouse transaction in this area, with a home price of $1.145 million, and sale price to list price ratio of 104%. The townhouse stayed on the market for 4 days.
Lastly, let's take a look at the transaction trends in the South Bay cities of Cupertino (95014), Campbell (95008), and the Peninsula city of Belmont (94002) in June 2024.
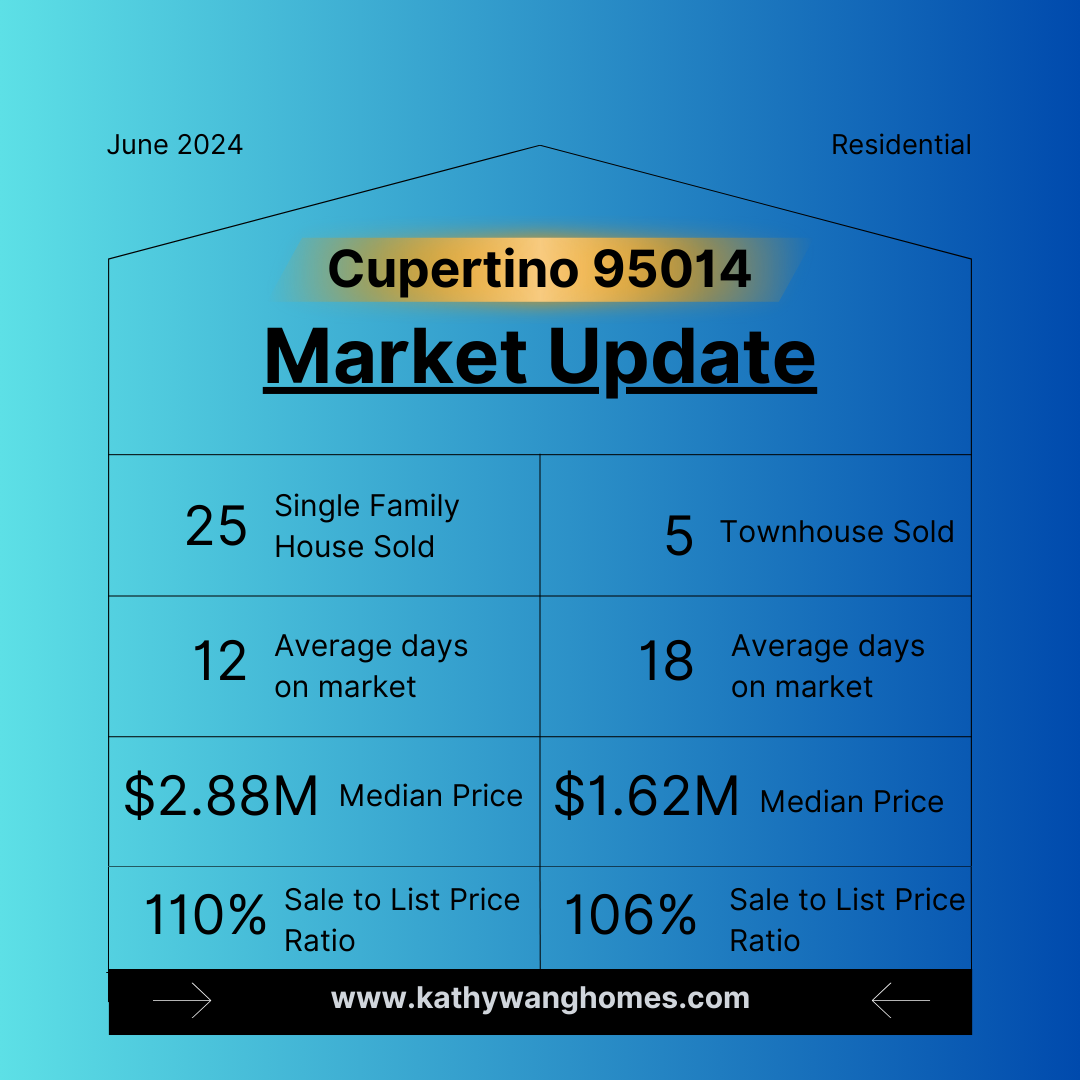
In Cupertino (95014) in June 2024, there were a total of 25 single-family home transactions. The median home price was $2.88 million, with an average sale price to list price ratio of 110%. Single-family homes in this area stayed on the market for an average of 12 days. Additionally, there were 5 townhouse transactions in this area, with a median home price of $1.62 million, and an average sale price to list price ratio of 106%. Townhouses in this area stayed on the market for an average of 18 days.
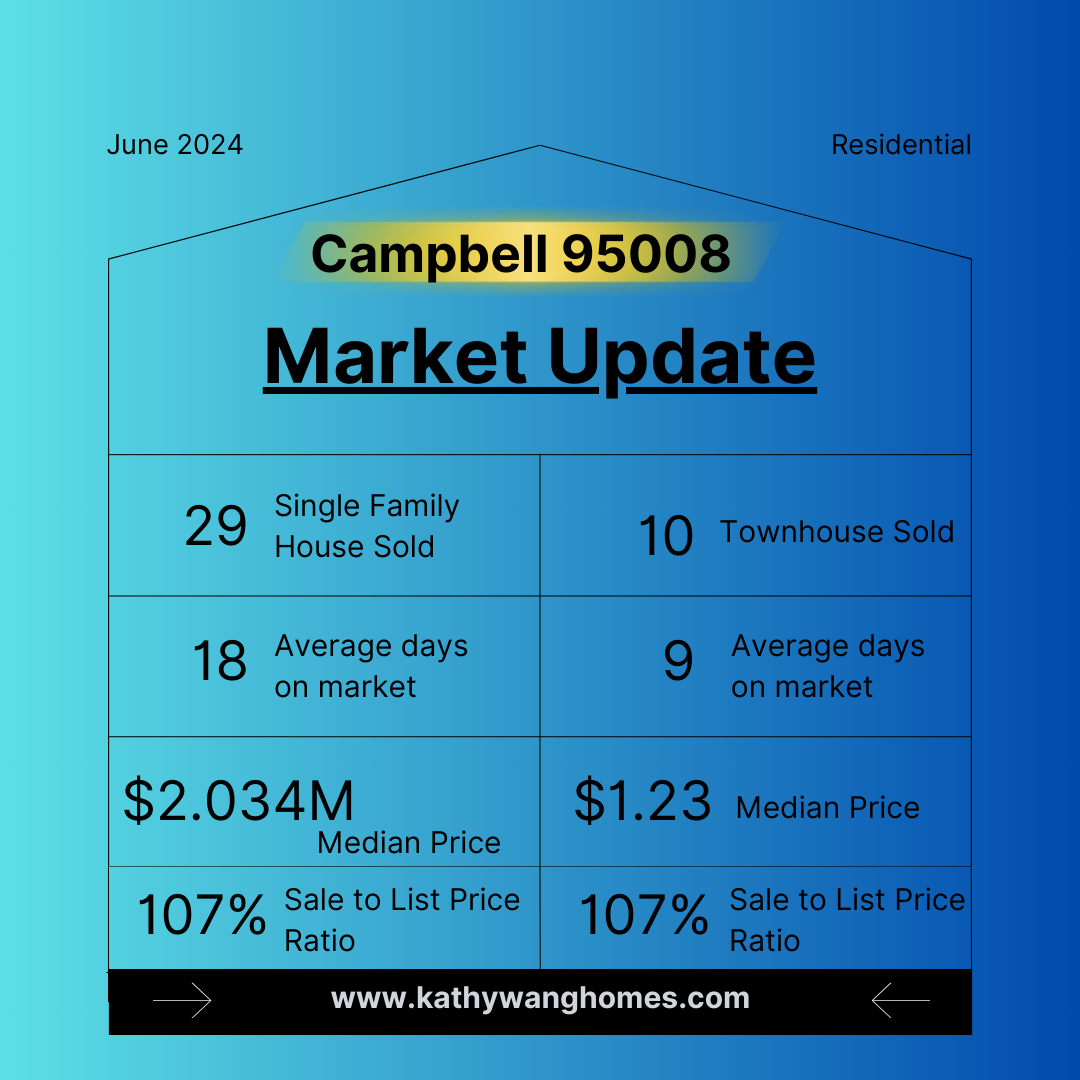
In Campbell (95008) in June 2024, there were a total of 29 single-family home transactions. The median home price was $2.034 million, with an average sale price to list price ratio of 107%. Single-family homes in this area stayed on the market for an average of 18 days. Additionally, there were 10 townhouse transactions in this area, with a median home price of $1.23 million, and an average sale price to list price ratio of 107%. Townhouses in this area stayed on the market for an average of 9 days.
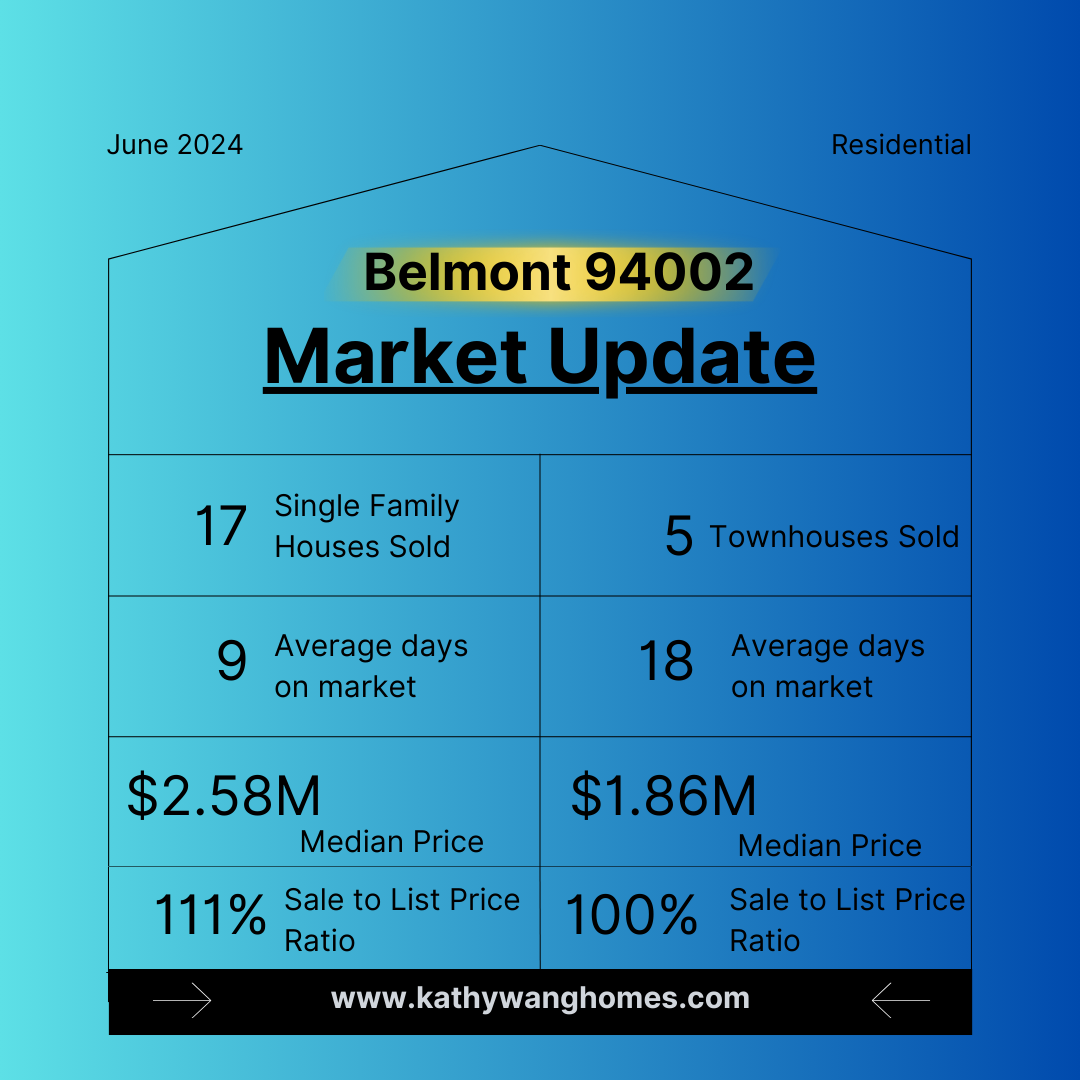
In Belmont (94002) in June 2024, there were a total of 17 single-family home transactions. The median home price was $2.58 million, with an average sale price to list price ratio of 111%. Single-family homes in this area stayed on the market for an average of 9 days. Additionally, there were 5 townhouse transactions in this area, with a median home price of $1.86 million, and an average sale price to list price of 100%. Townhouses in this area stayed on the market for an average of 18 days.
The above analysis provides a detailed overview of the real estate market trends in several cities in the Silicon Valley region for June 2024, as analyzed by the KathyWangHomes team. If you would like to learn more about the real estate market in additional cities or areas in the San Francisco Bay Area, please feel free to contact us.